Everyone (including Mr. & Mrs. Smith) should have their own data dashboards.
Hihi, at our personal DNA (Data and AI) department, we've built our database and started ingesting our personal data to the database using some Python scripts. Moreover, we can use database clients like DBeaver to see the data, but in a not so friendly way, just in terms of tables. How can we further visualise the data? Simple data visualisation can just unlock so many insights. A self-hosted data dashboard is a must-to-have component for our personal DNA department.

What is a data dashboard? (ChatGPT definition) #
'A data dashboard is a visual representation of key performance indicators (KPIs), metrics, and other important data points, typically presented in a graphical format. It provides a consolidated view of an organization's data, allowing users to monitor trends, analyze performance, and make informed decisions.'
Apparently, ChatGPT assumes the dashboard is typically used for an organization, but I mean we can also do exactly the same things of ourselves, by ourselves and for ourselves. After all, an organization could also be a one-person organization. People have their own KPIs, even though sometimes we're not aware of them or haven't just quantified them. Just think about our new year resolutions. If they could be quantified, they could potentially be tracked and analyzed in a dashboard.
Why a self-hosted data dashboard (vs. creating charts in Google Sheet) #
The name 'Google Sheet' implies that it is mainly about sheets. The chart creation is not powerful at all based on my limited experience with it. More important, we've adopted the philosophy of maintaining our personal single source of truth in a database, instead of all over the place in google sheets. A self-hosted data dashboard that can be connected to database is a natural choice.
Types of dashboards #
There are several types of dashboards, with two of the most common being pre-built dashboards with SQL interface and customizable dashboards with code-based interfaces. Tableau, Superset, Metabase, etc. fall into the former, while Python libraries like Dash and Streamlit fall into the latter. Dashboards like metabase with SQL interface provide a user-friendly interface where users can connect to databases and build dashboards by writing SQL queries and using a drag-and-drop interface. Dashboards like Streamlit with code-based interface require scripting to build visualisations, but they do offer greater flexibility and customization options compared to pre-built solutions.
There are other specific dashboard types, for example, dashboards that are good at plotting geospatial information on the maps (e.g., Kepler), dashboards that are more suitable for real-time streaming data (e.g., Grafana) and dashboards that are dedicatedly for graph-structure data (e.g., Neo4j). We leave them out of the scope for now. Later when specific needs come, we can deep dive into those tools as well. The principal is more or less the same though. We want a place where we can plug in our databases and get the data visualised.
While I use Streamlit from time to time (e.g., a streamlit-based dashboard tracking the "ETF" co-owned by me and my several friends), my go-to dashboard for my personal DNA projects is Metabase. It's extremely simple to use and meets all my needs to track and analyse my own data.
How to host a dashboard by yourself? #
Hosting a dashboard by yourself is way easier than you could imagine, just like hosting a database by yourself. To host Metabase on our local laptop, again a docker compose file (see the official doc about how to write a docker compose file for Metabase) and a simple docker-compose up command would quickly set up one. Note that you would need to set up your database and your Metabase in the same docker network, so that they can talk to each other. In our case, it's important that Metabase can seamlessly connect to the self-hosted database.
How to create a dashboard? #
Let's assume we currently host our dashboard at localhost:3000. Just go to localhost:3000 in your web browser and you will see the ready-to-use Metabase interface. As an admin, you're by default both a dashboard developer and a dashboard user. Since the organisation only includes yourself, there is no data governance thing you need to worry about.
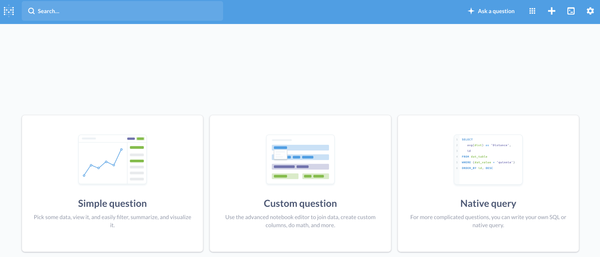
In Metabase, a dashboard is composed of multiple questions. A question is just a single data visualisation view based on a certain SQL query. To create a question, I always prefer to write my own queries as a data scientist myself, just to have the full flexibility, but it is also possible that you do it in a beginner-friendly way. Metabase can understand data structures quite well. You can choose to ask data questions without writing any SQL but just clicking some options Metabase prepared for you.
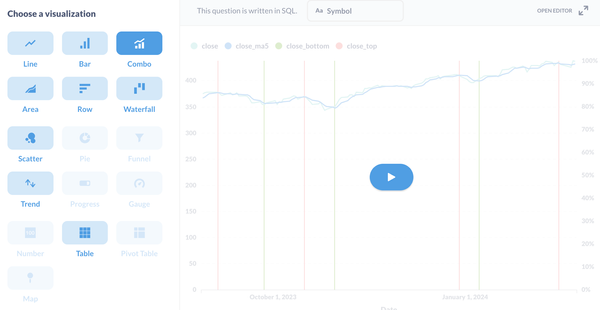
After processing the data, either through SQL or clicking options on the user interface, you can start visualising the processed data for this question. Based on the structure of processed data, Metabase will offer you all the possible types of visualisations. Choose one and the data will be immediately displayed.
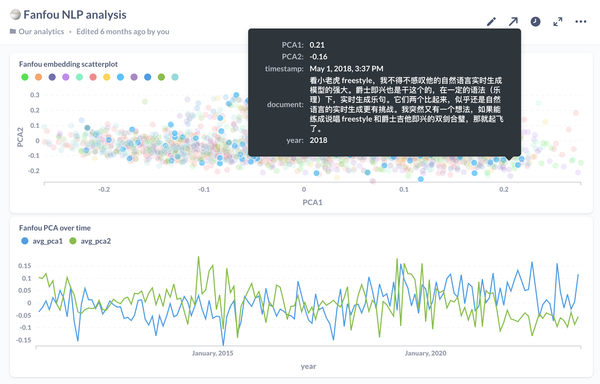
Once you've created all the questions and get them answered by the visuals, you can bring them together into one dashboard. Here is an example of my dashboards. I ingested all my Fanfou (Chinese Twitter especially for Chinese hipsters) posts and stored them in my database. I used a language embedding model to turn every post into an embedding vector. Then I reduced the dimensions to 2 by running a PCA (principal component analysis) algorithm to the embedding vectors.
In the first question view, I plot the data points of my Fanfou posts in the two dimensions and use colors to indicate the year of the post. In the second question view, I plot the time series of two dimensions of PC (principal components). Apparently, my 2nd-dimension PC has decreased a lot in recent years. I'm not very sure about the virtue of the story yet regarding this mysterious PC2, but it's a lot of fun to have my own text data to be analyzed and visualized.